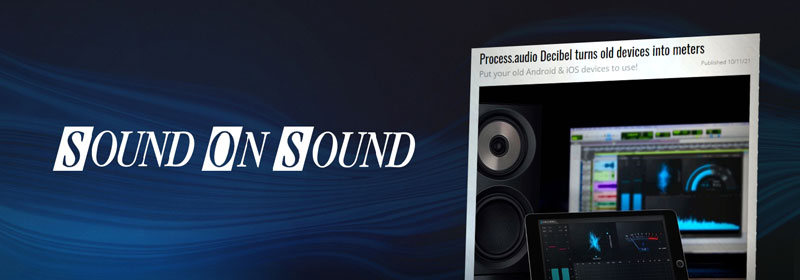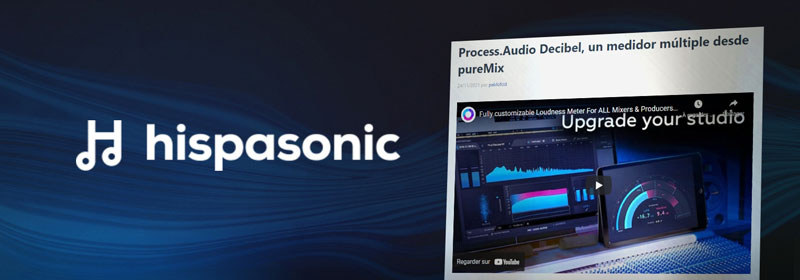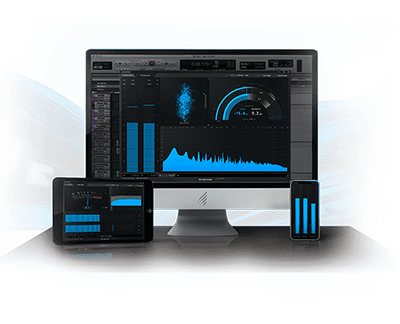
ONE METER
TO RULE THEM ALL
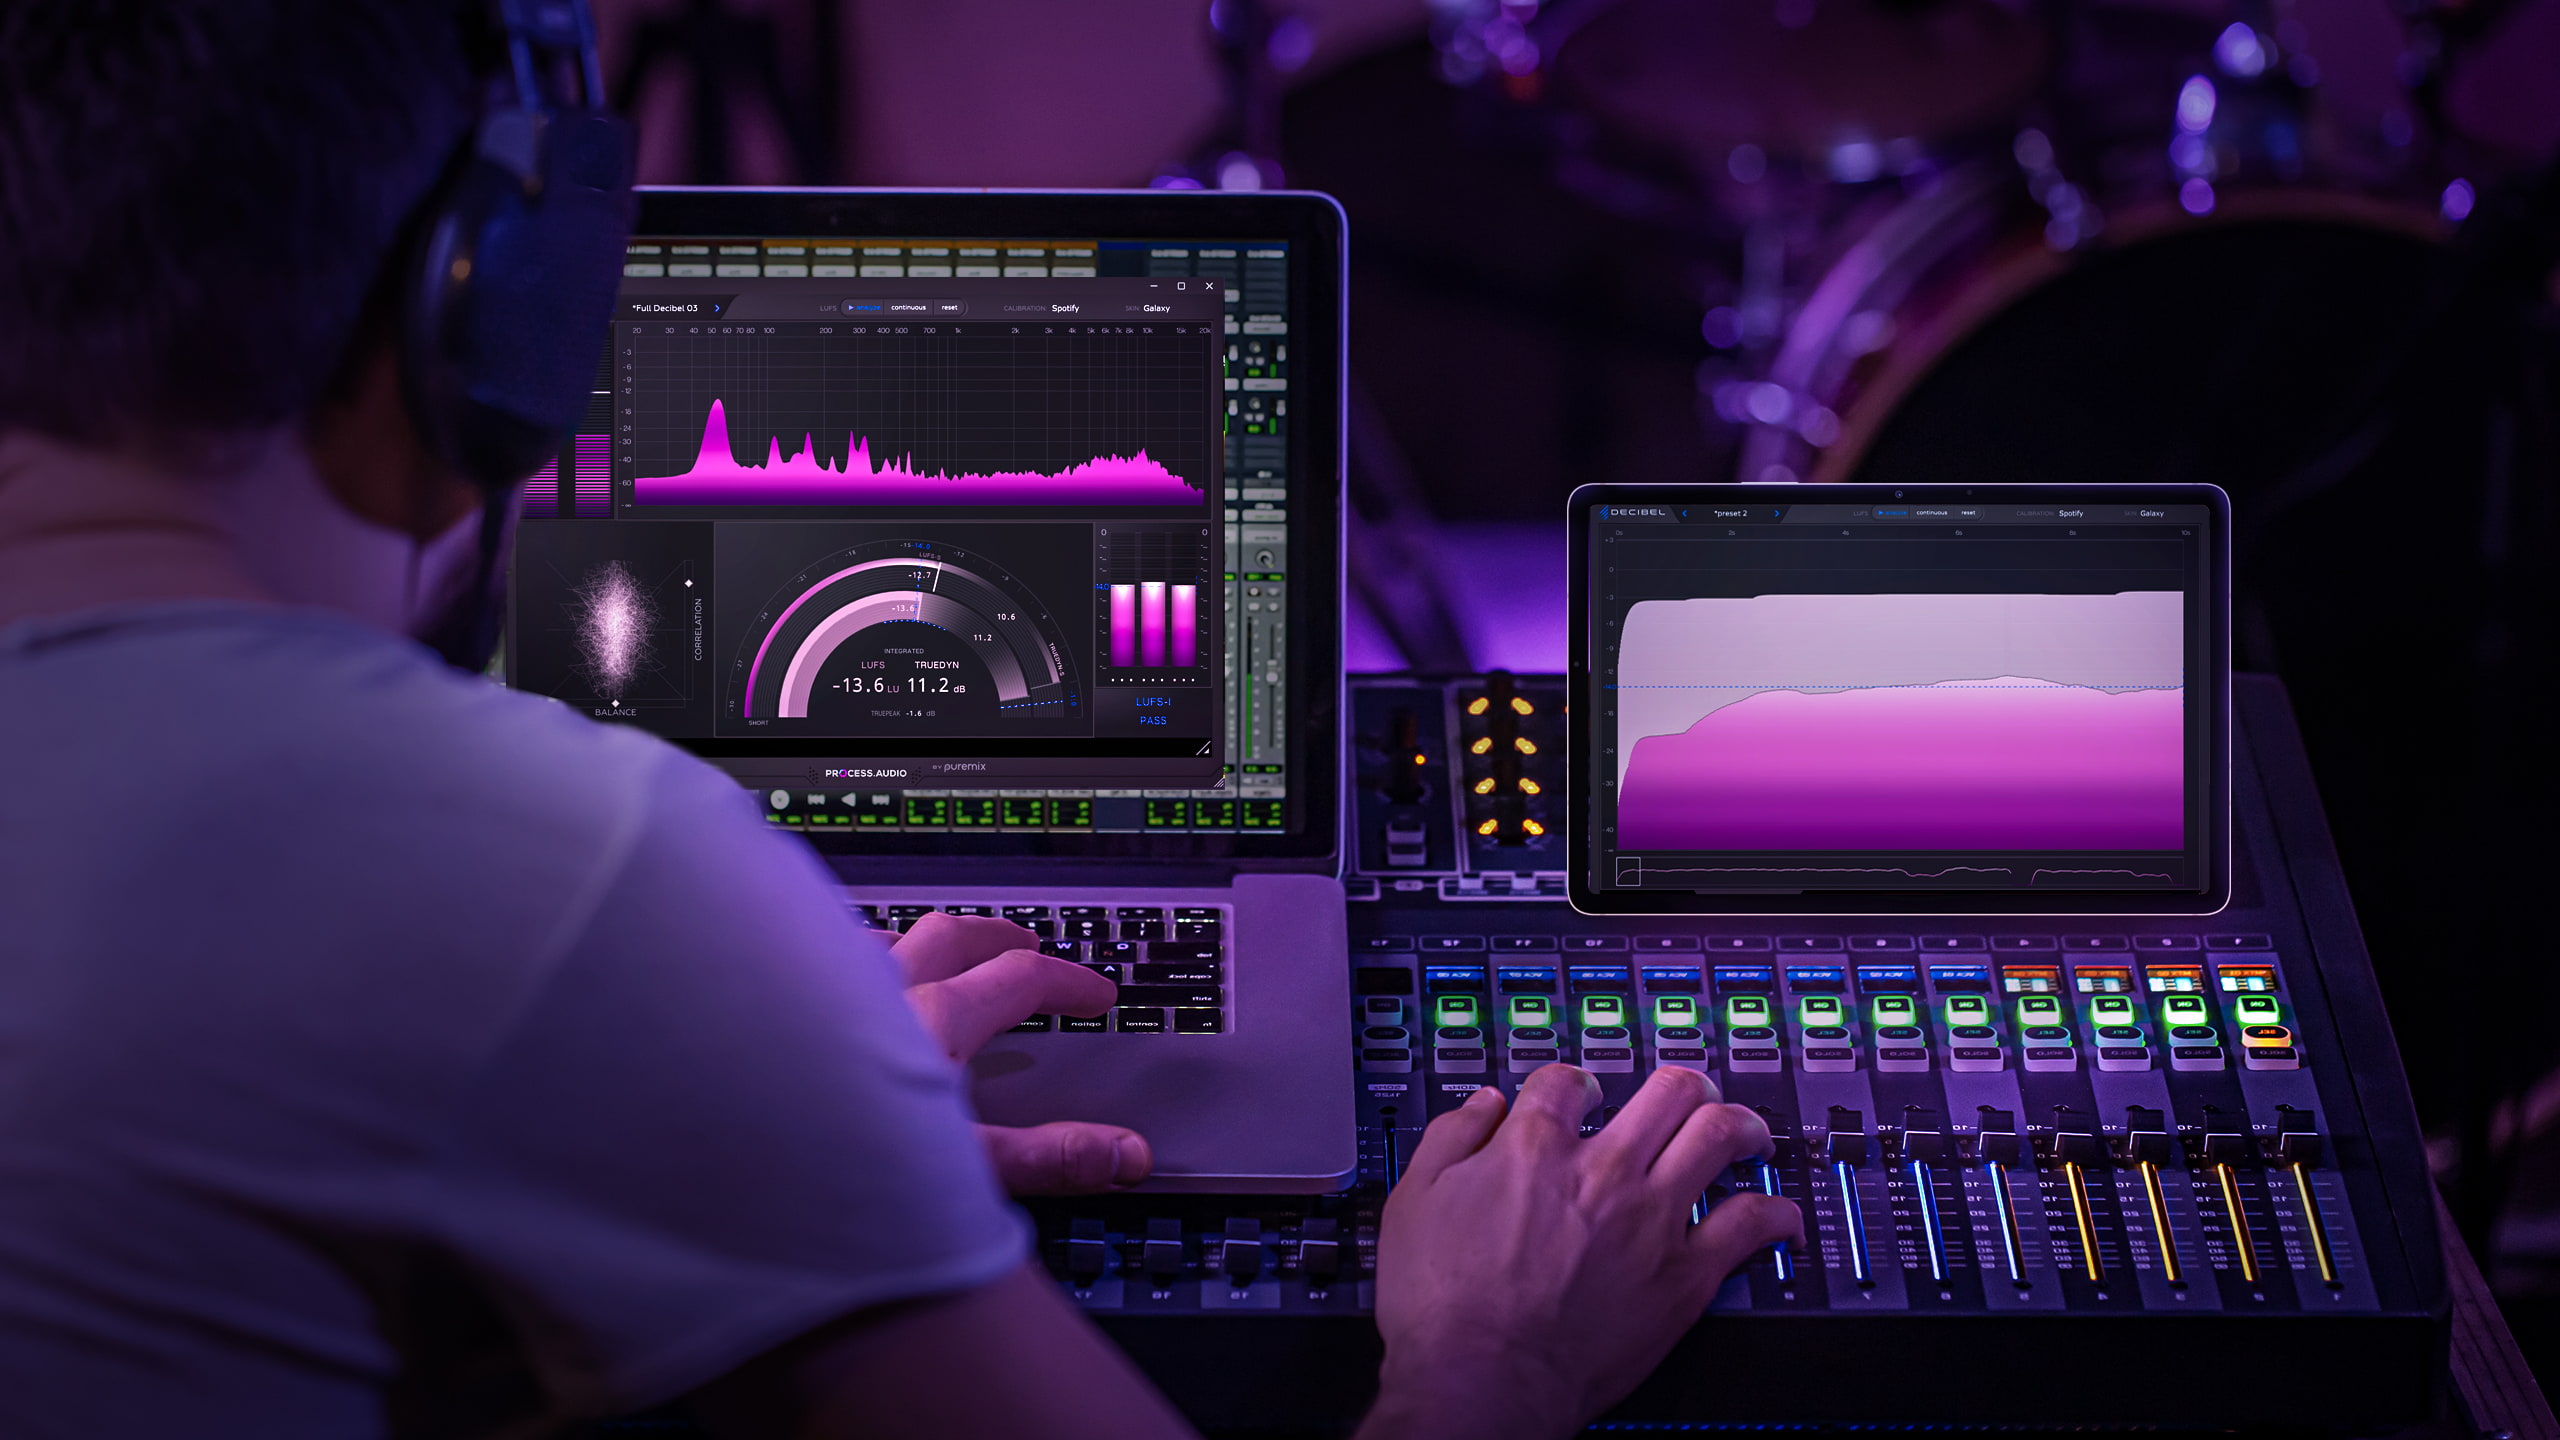
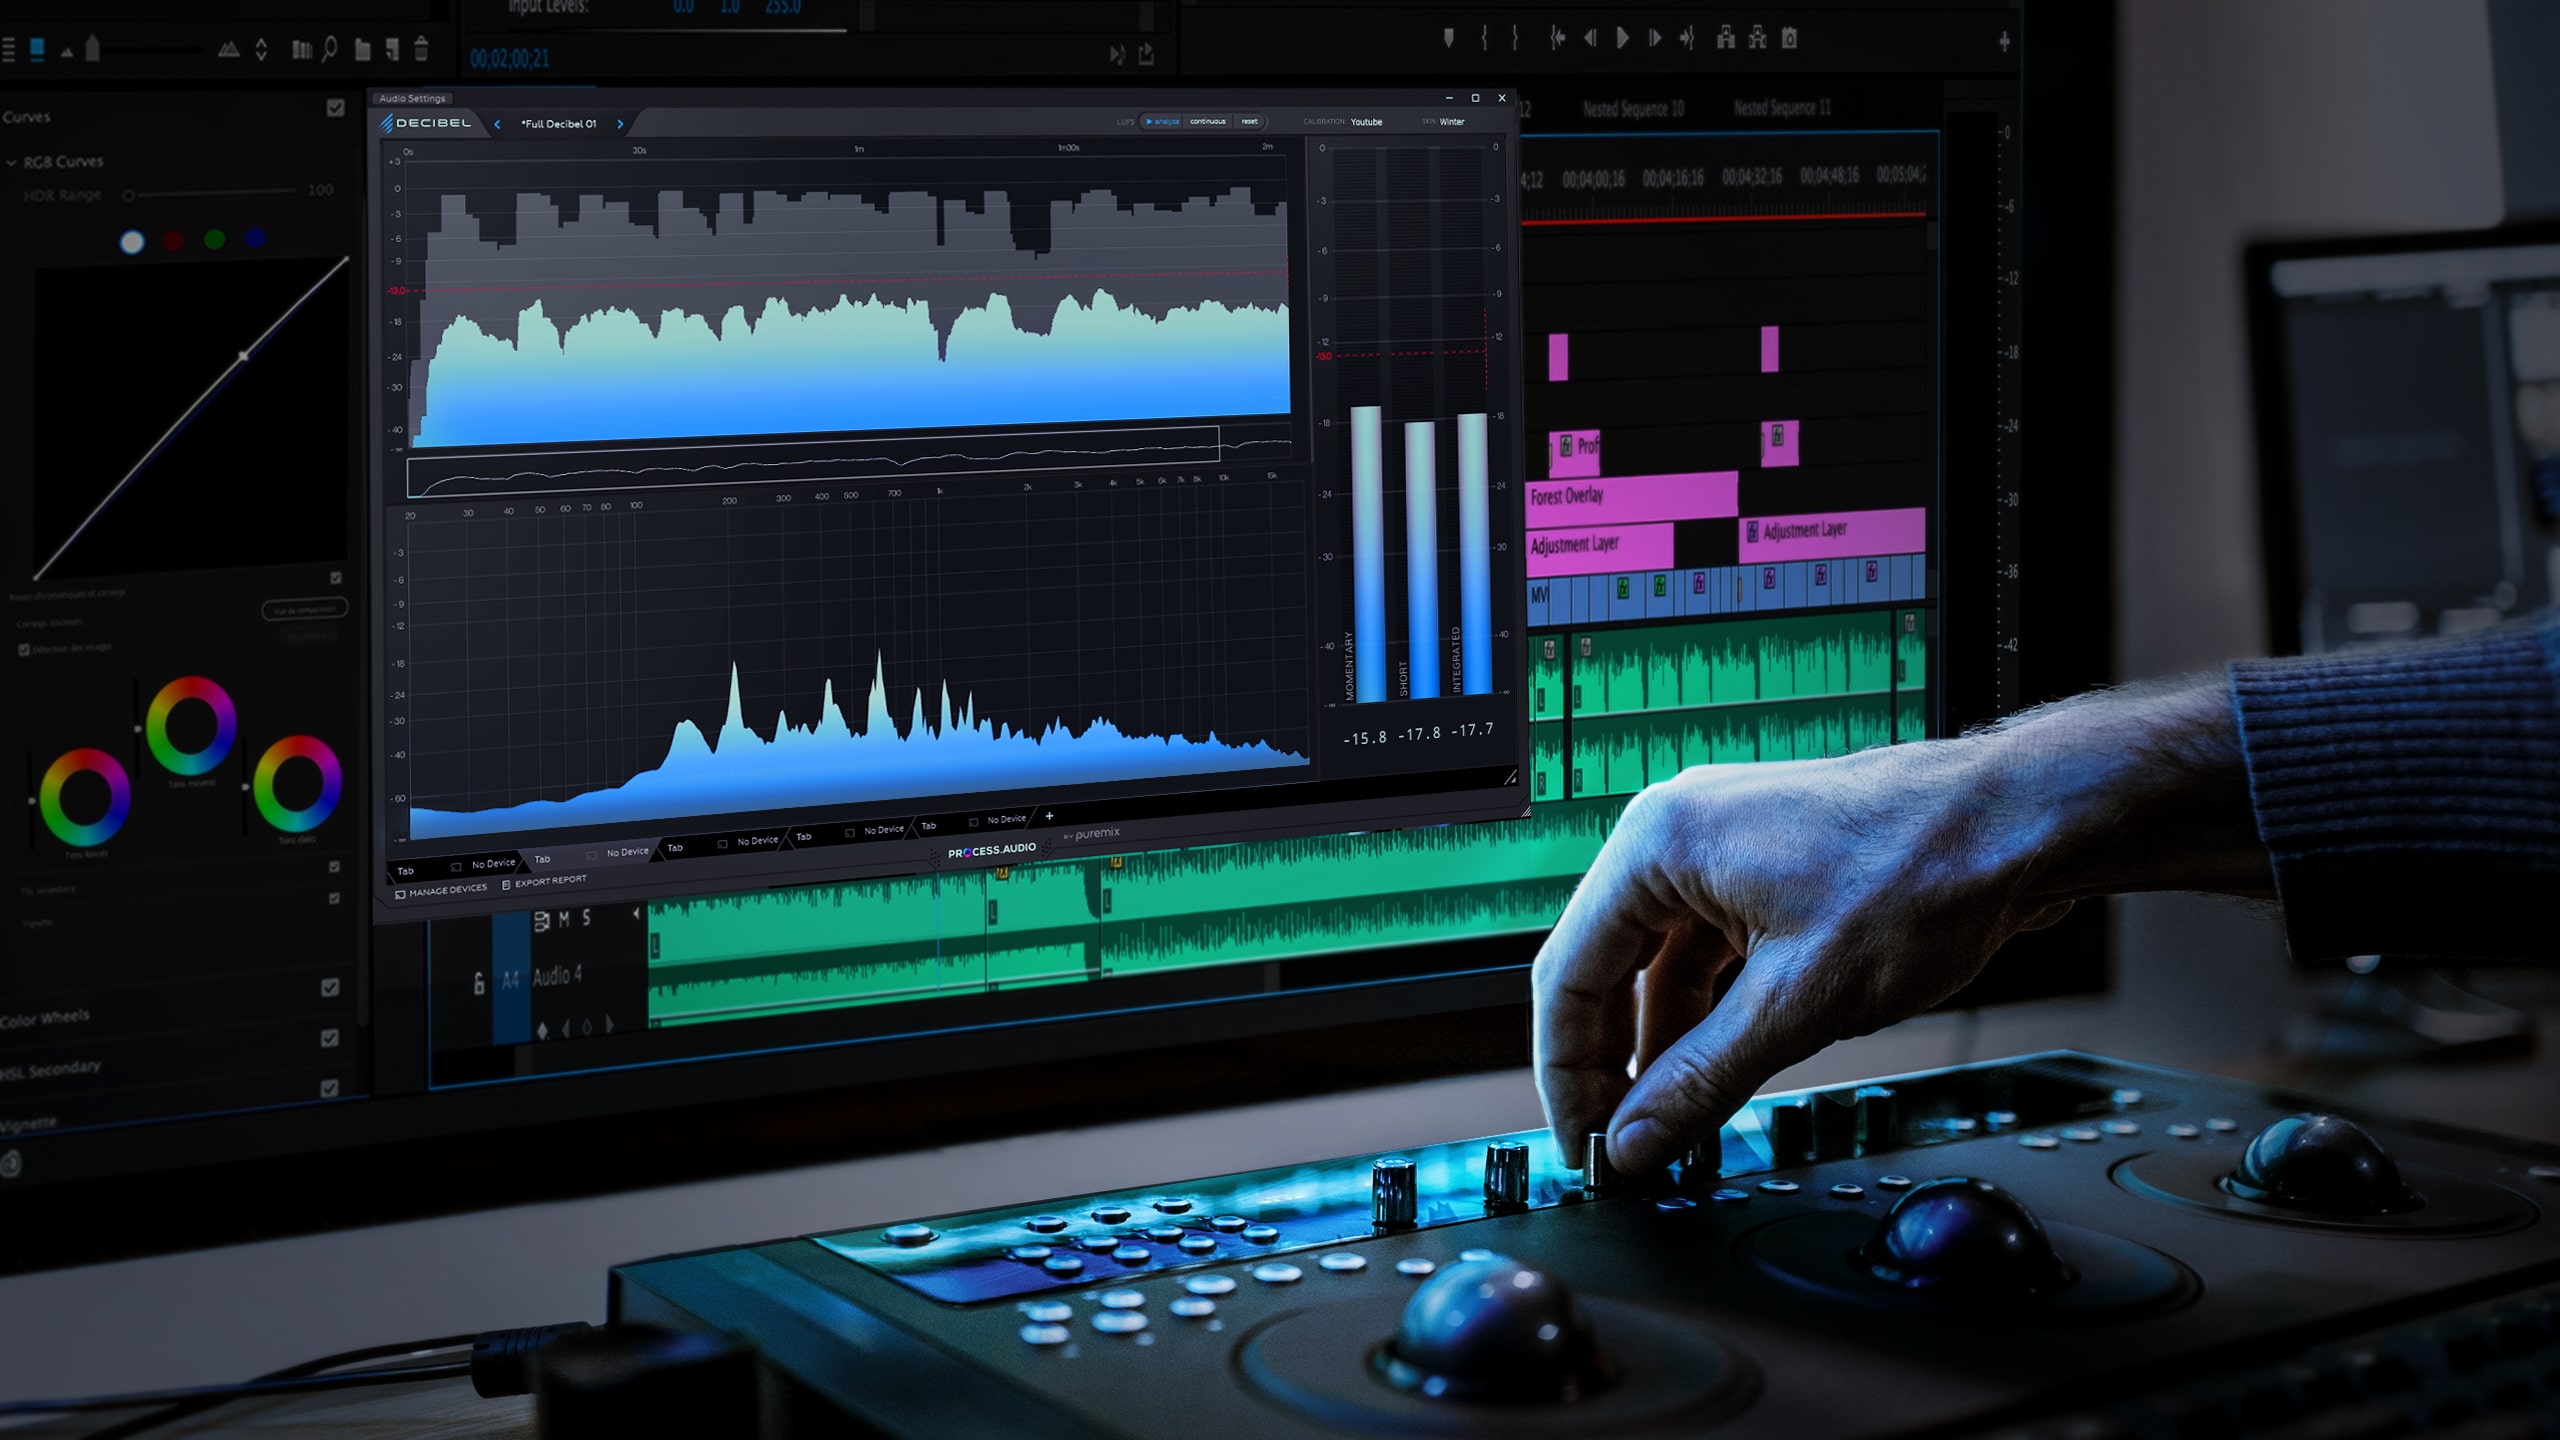
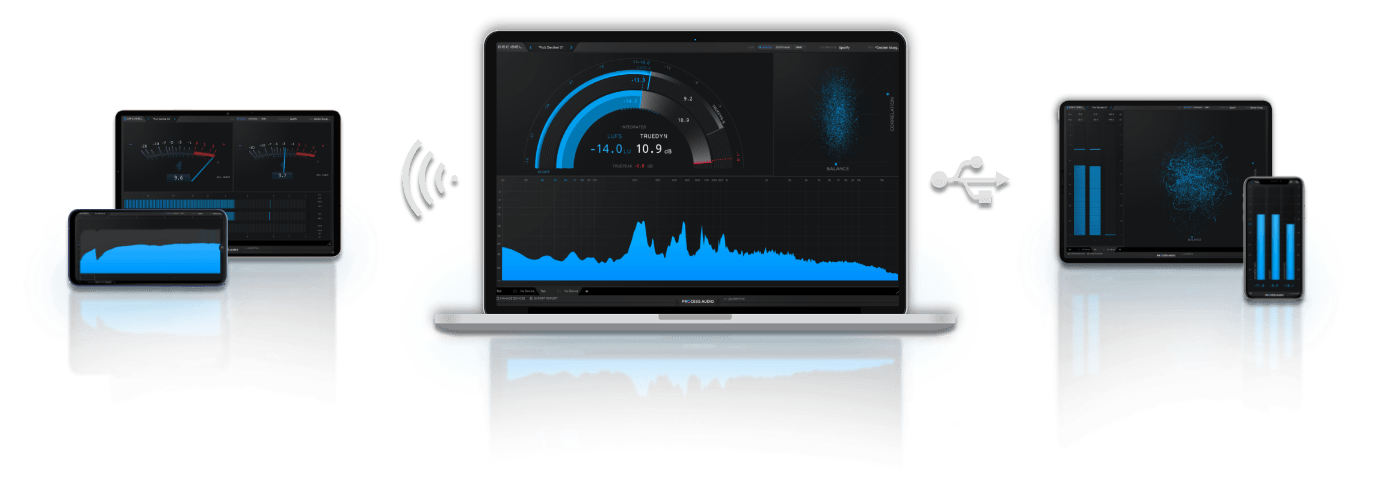
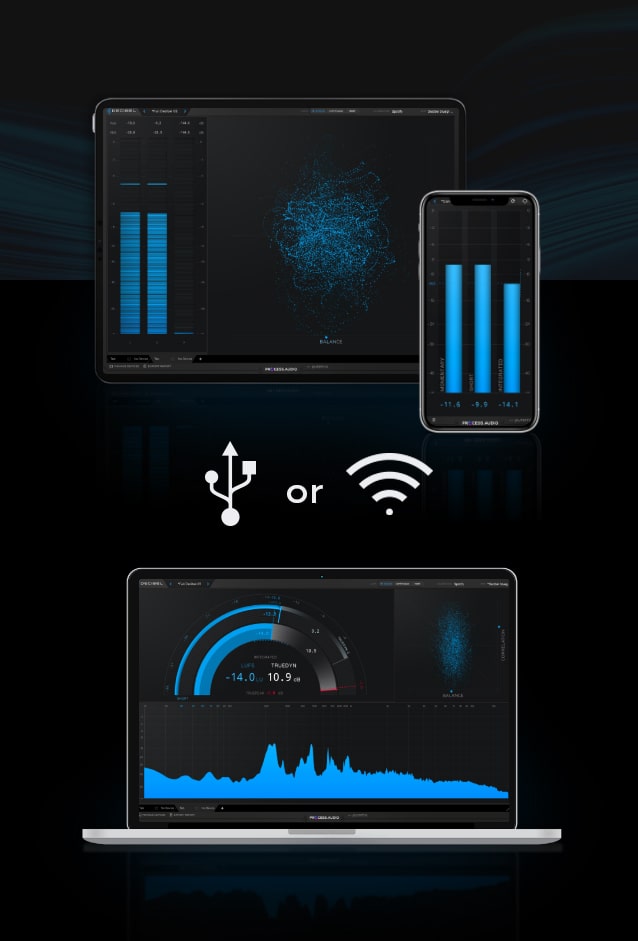
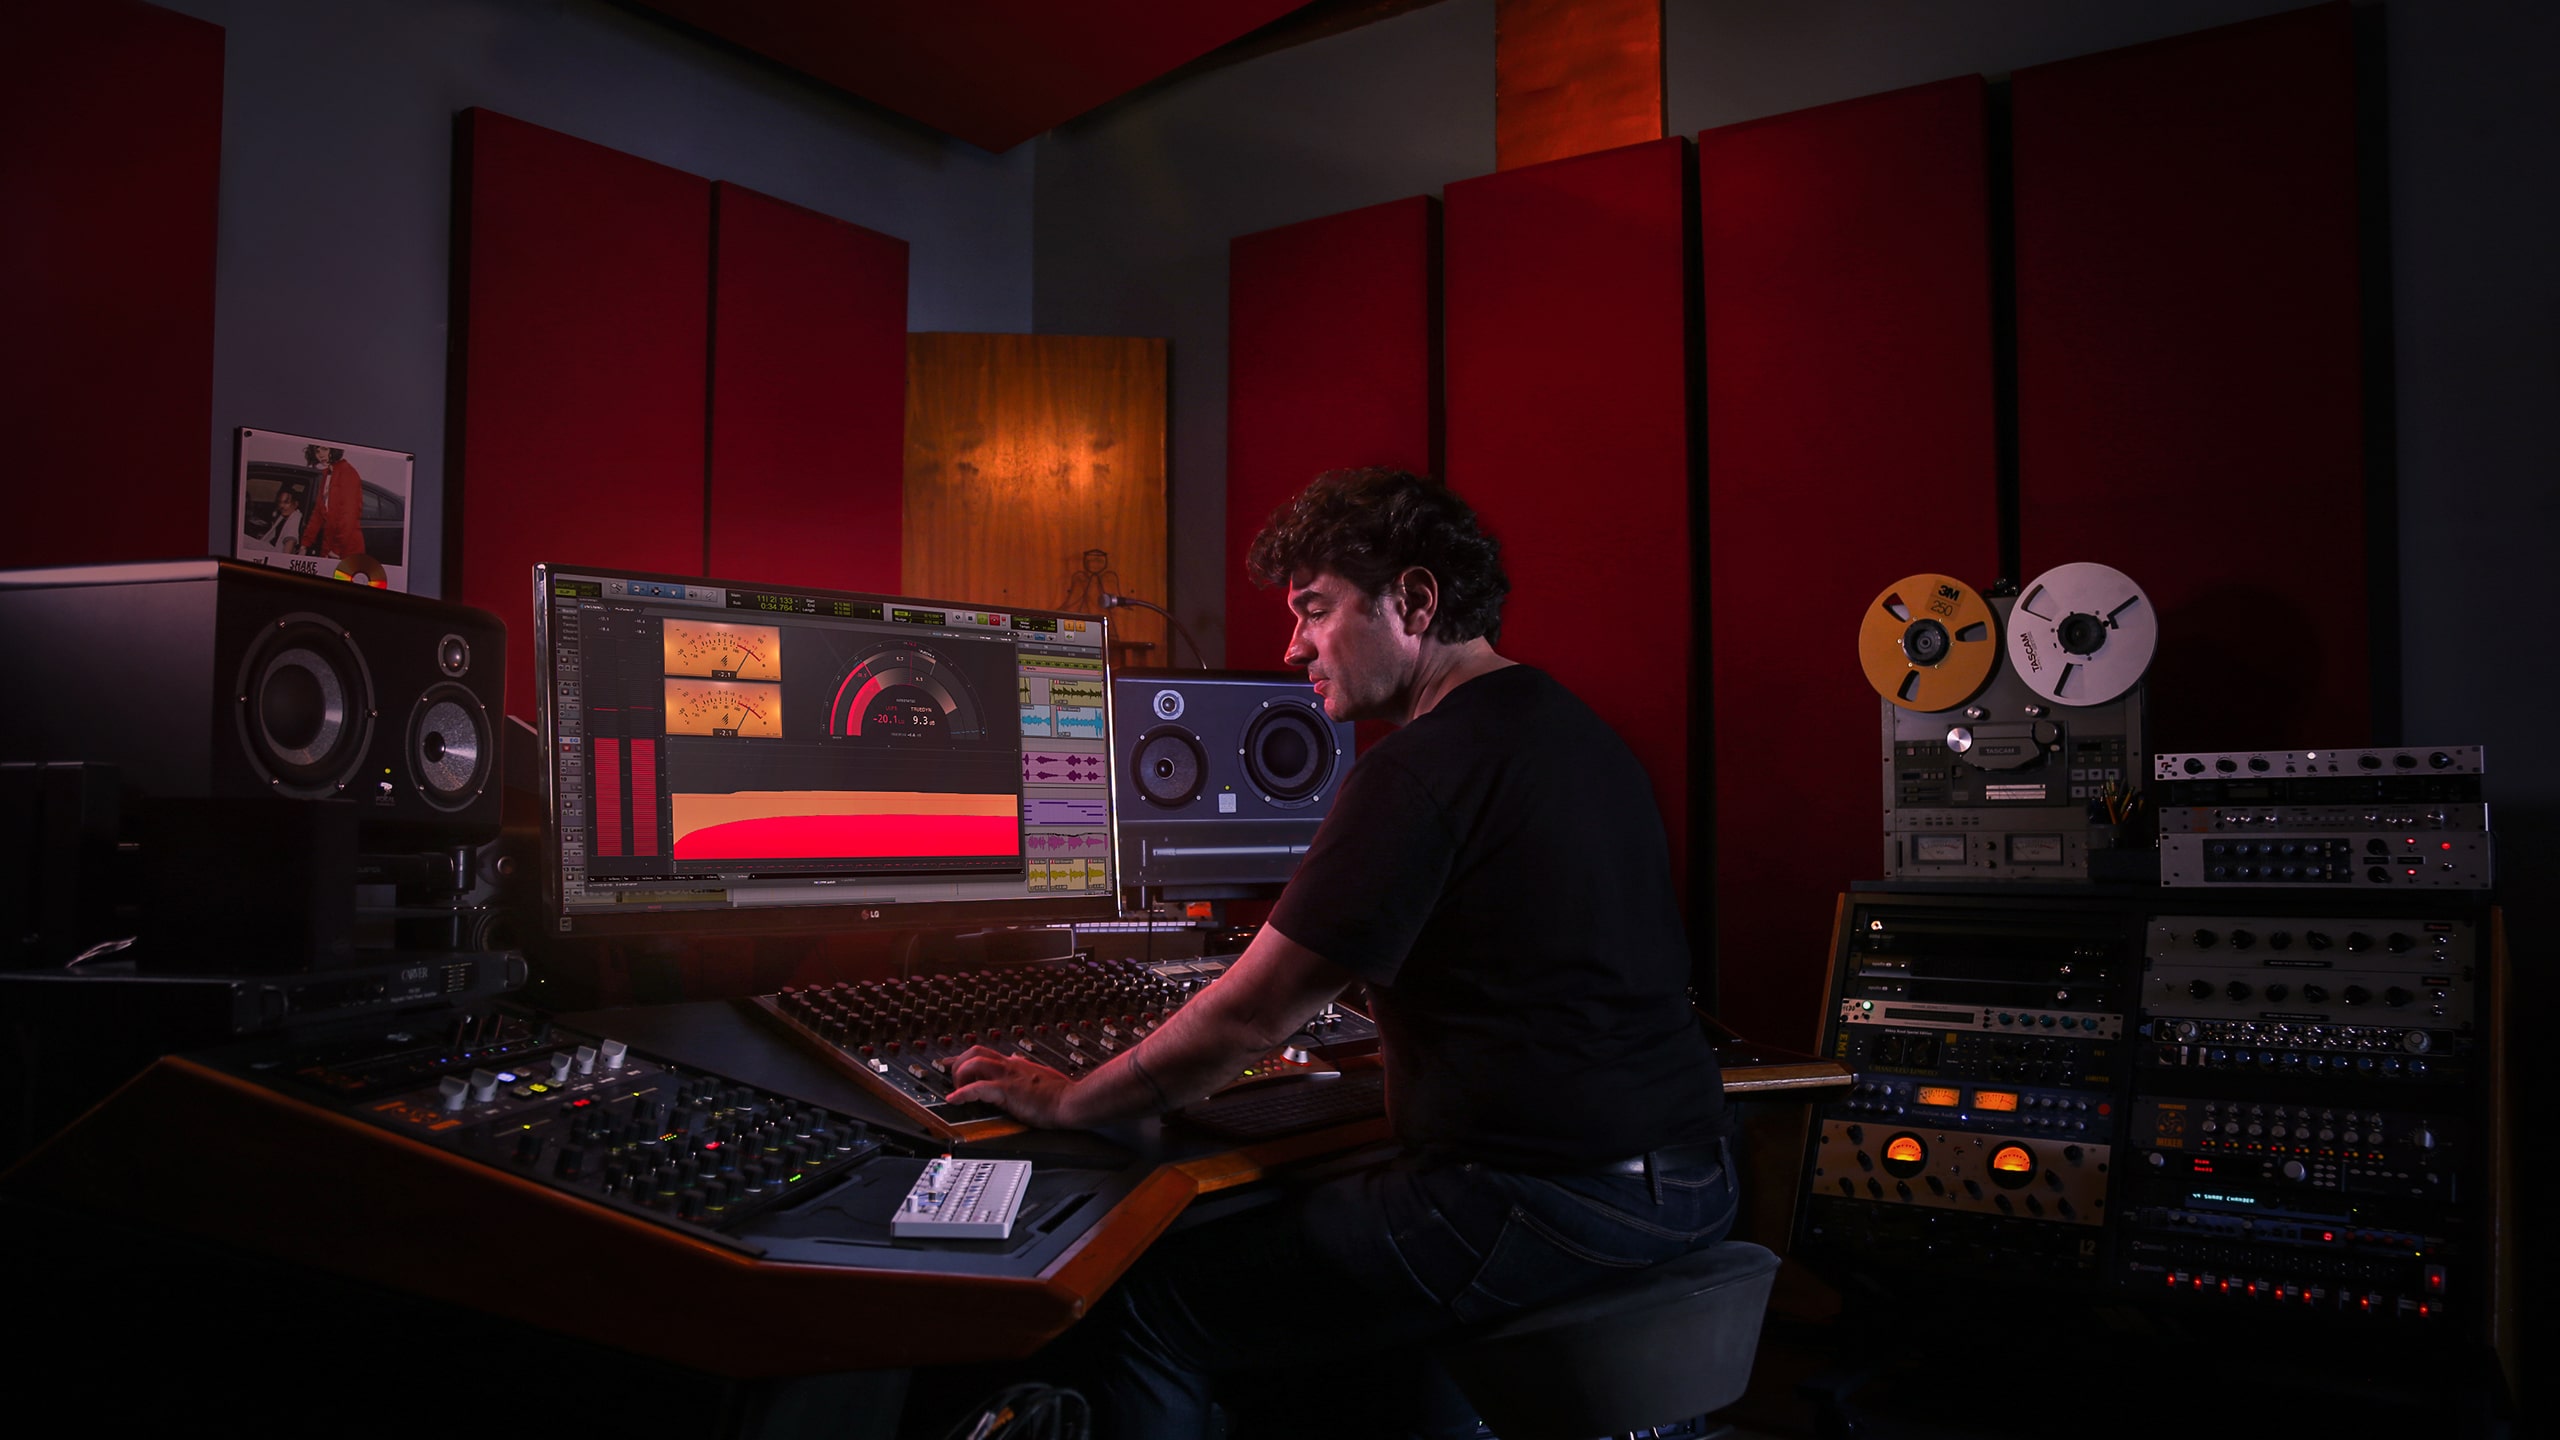
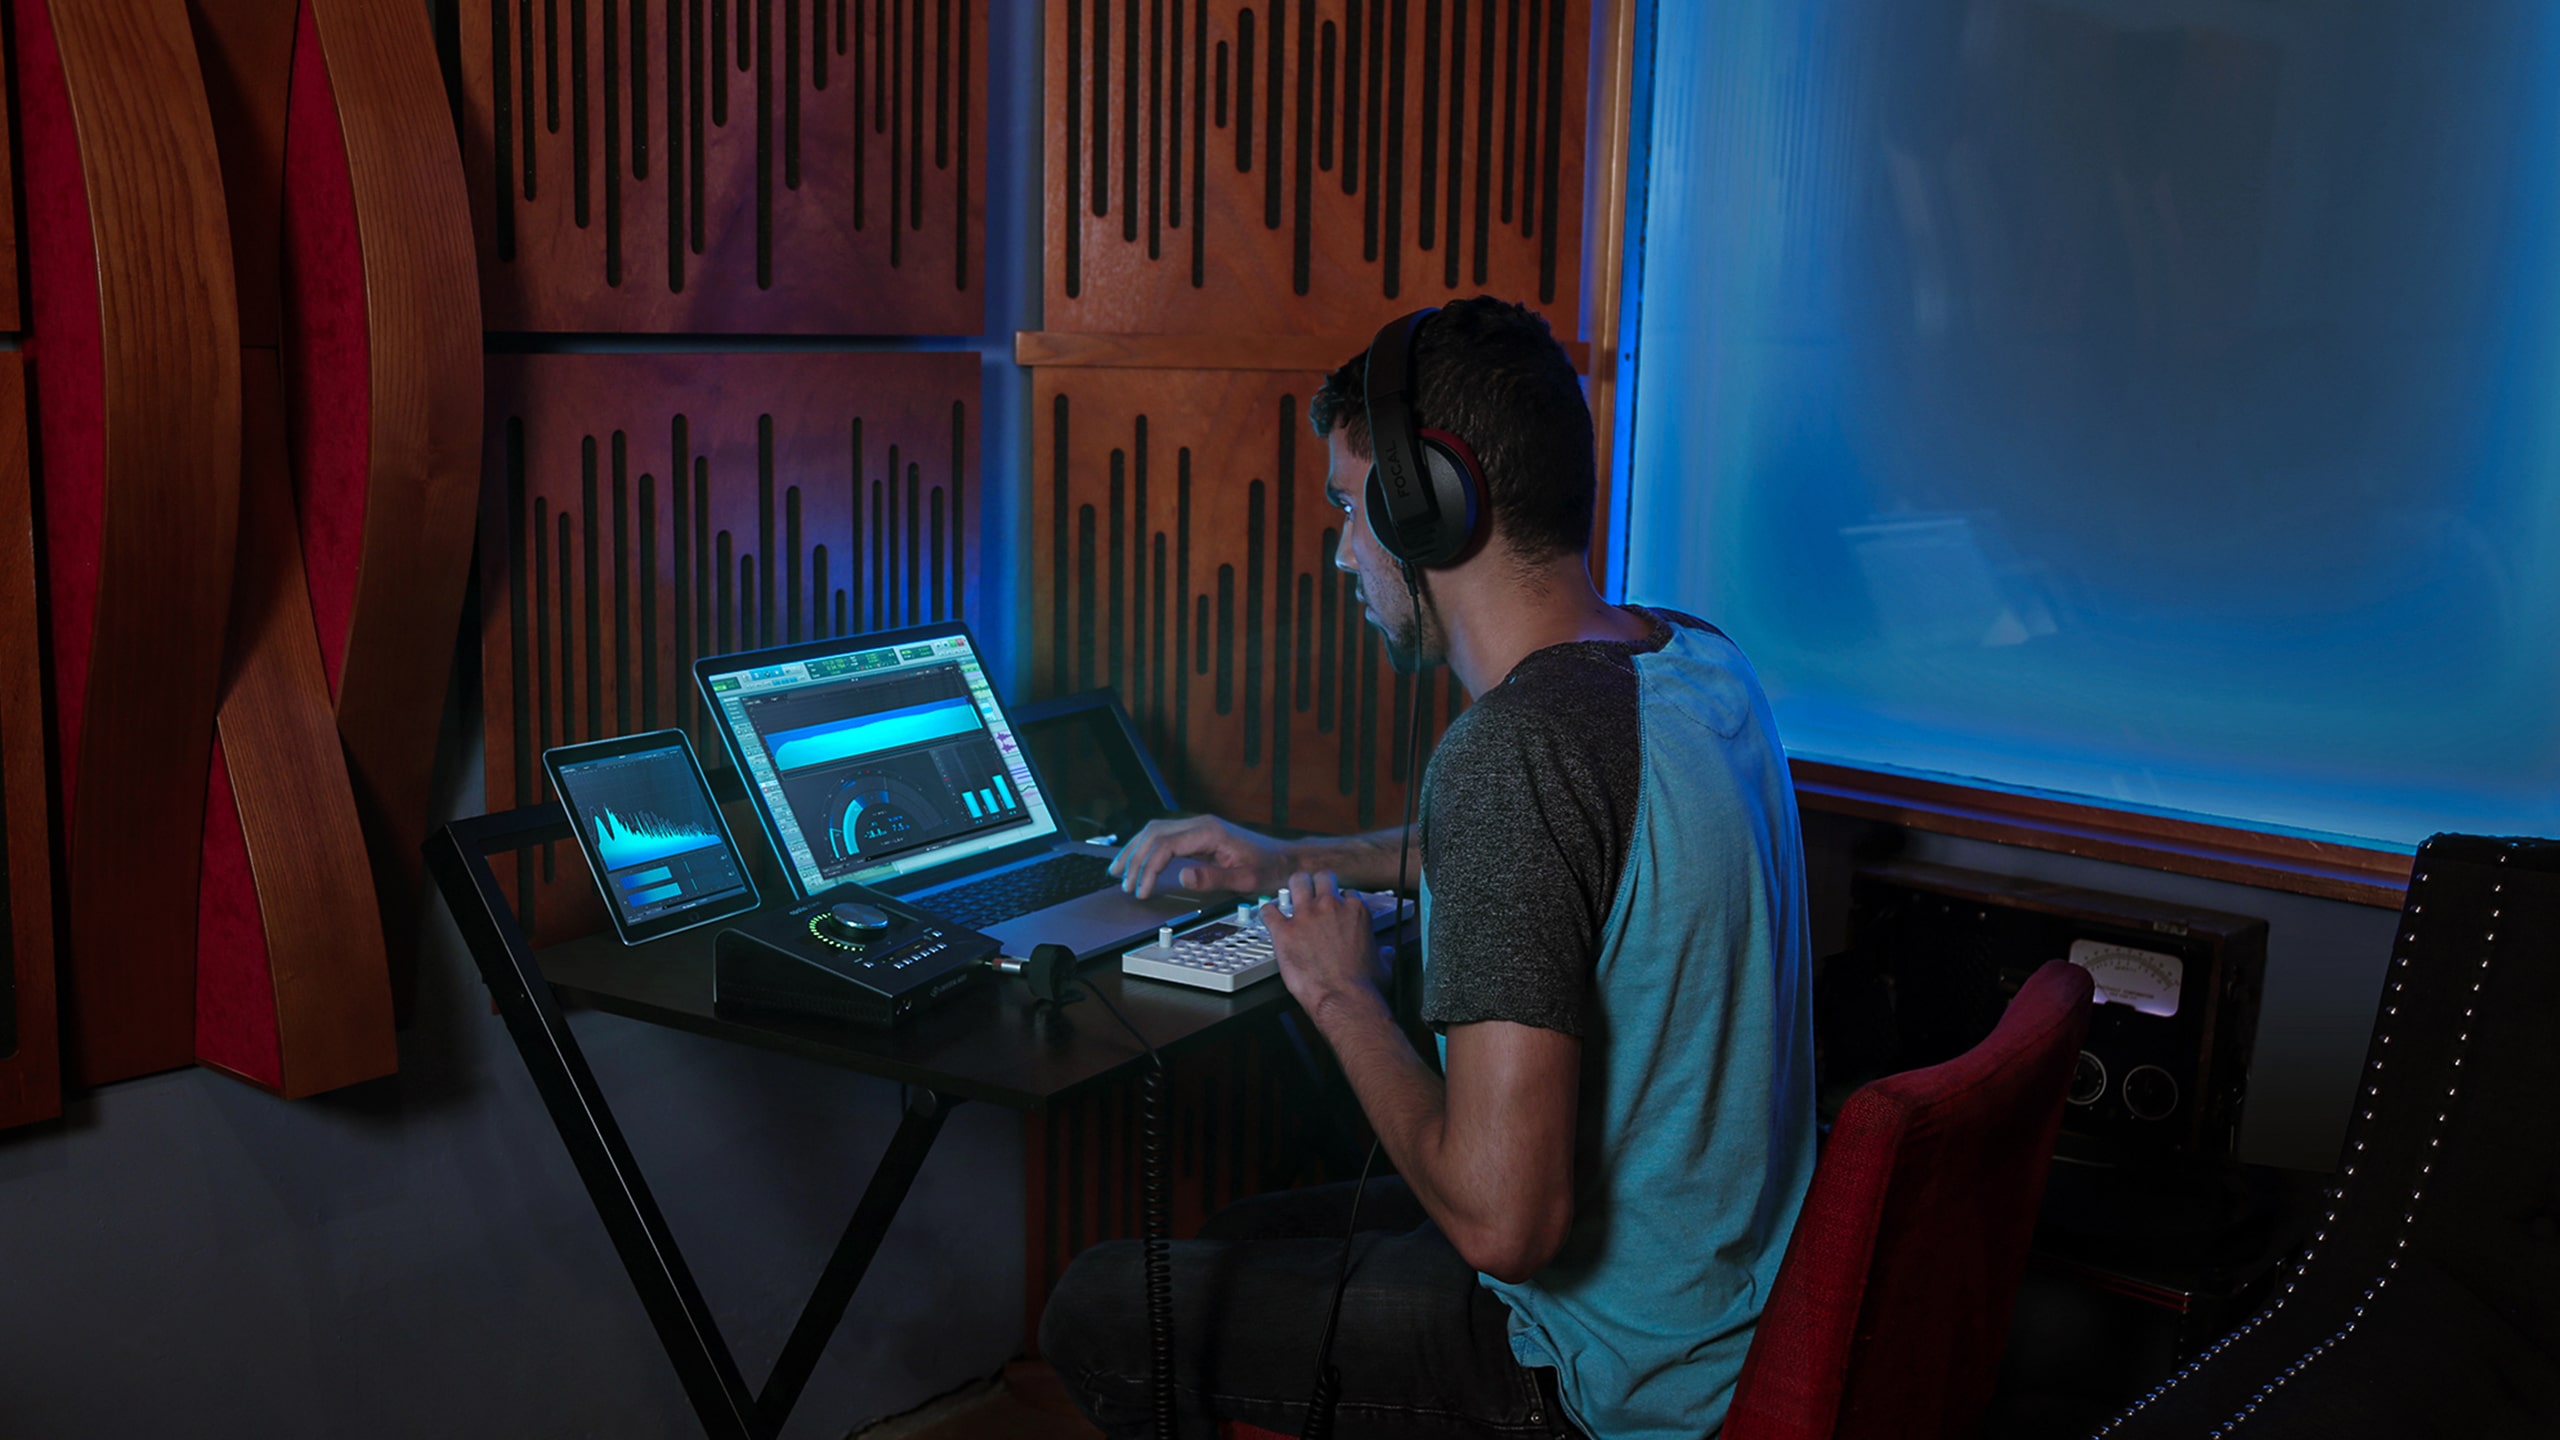
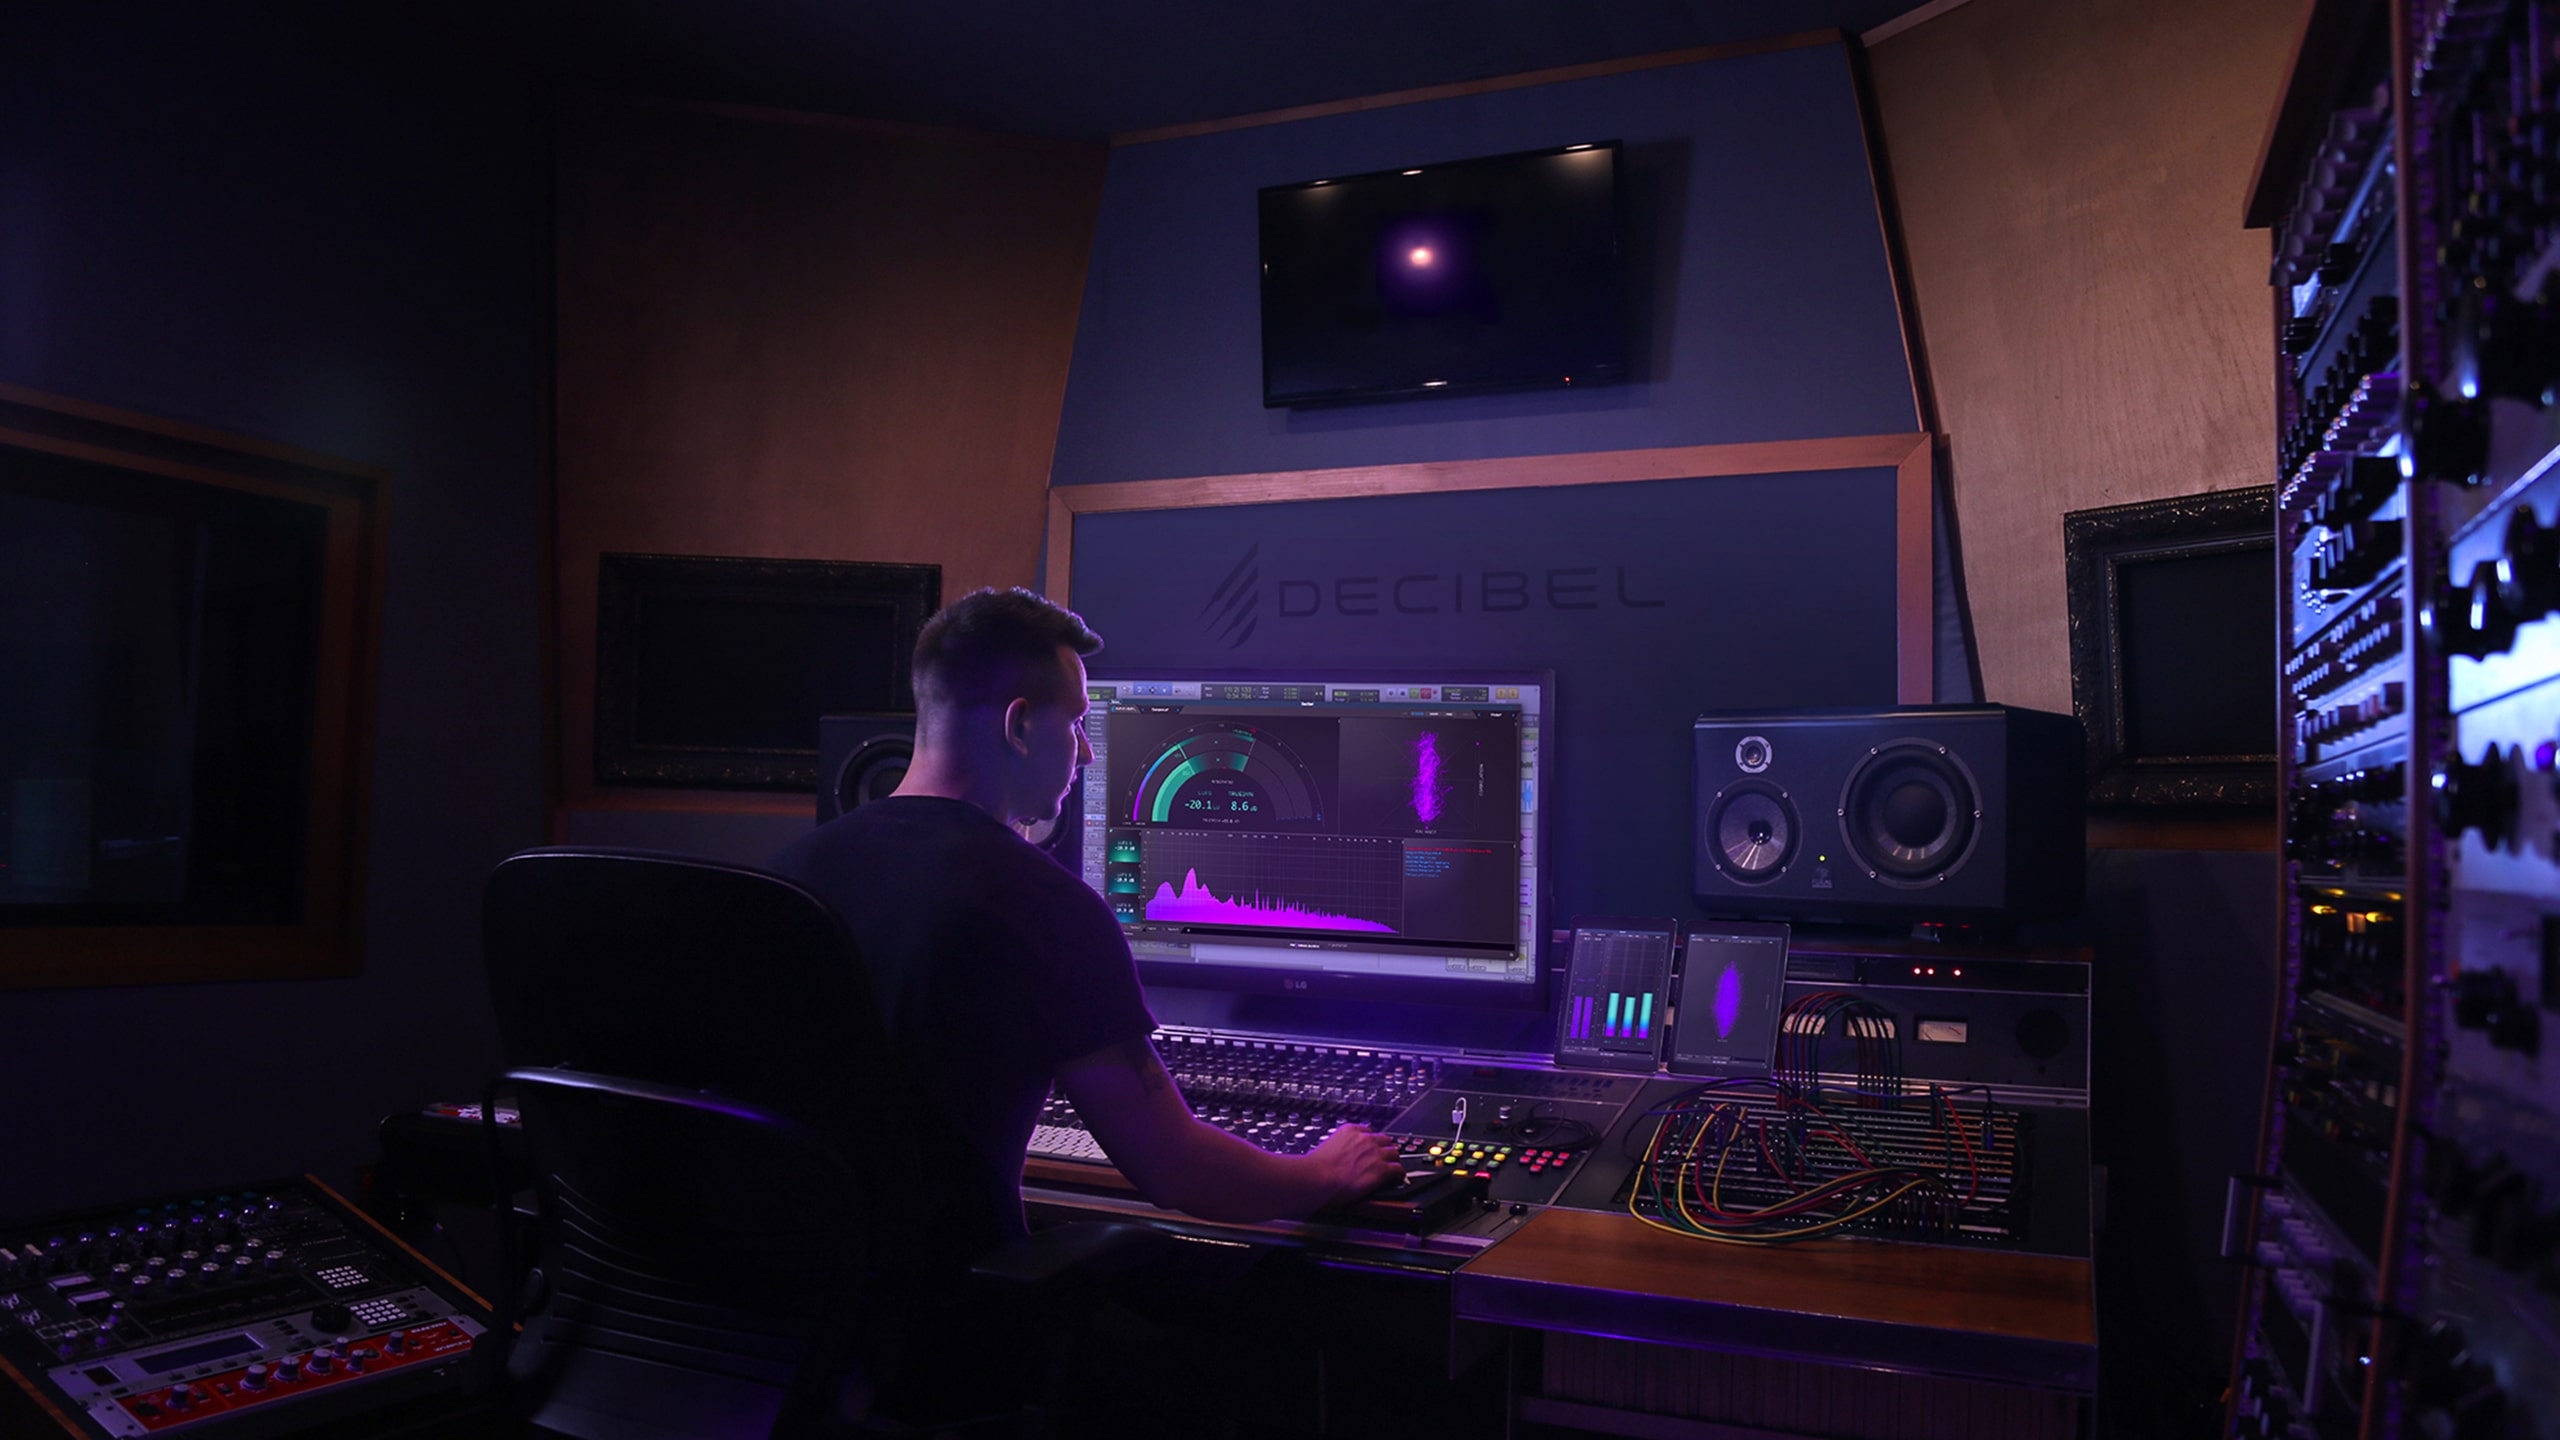
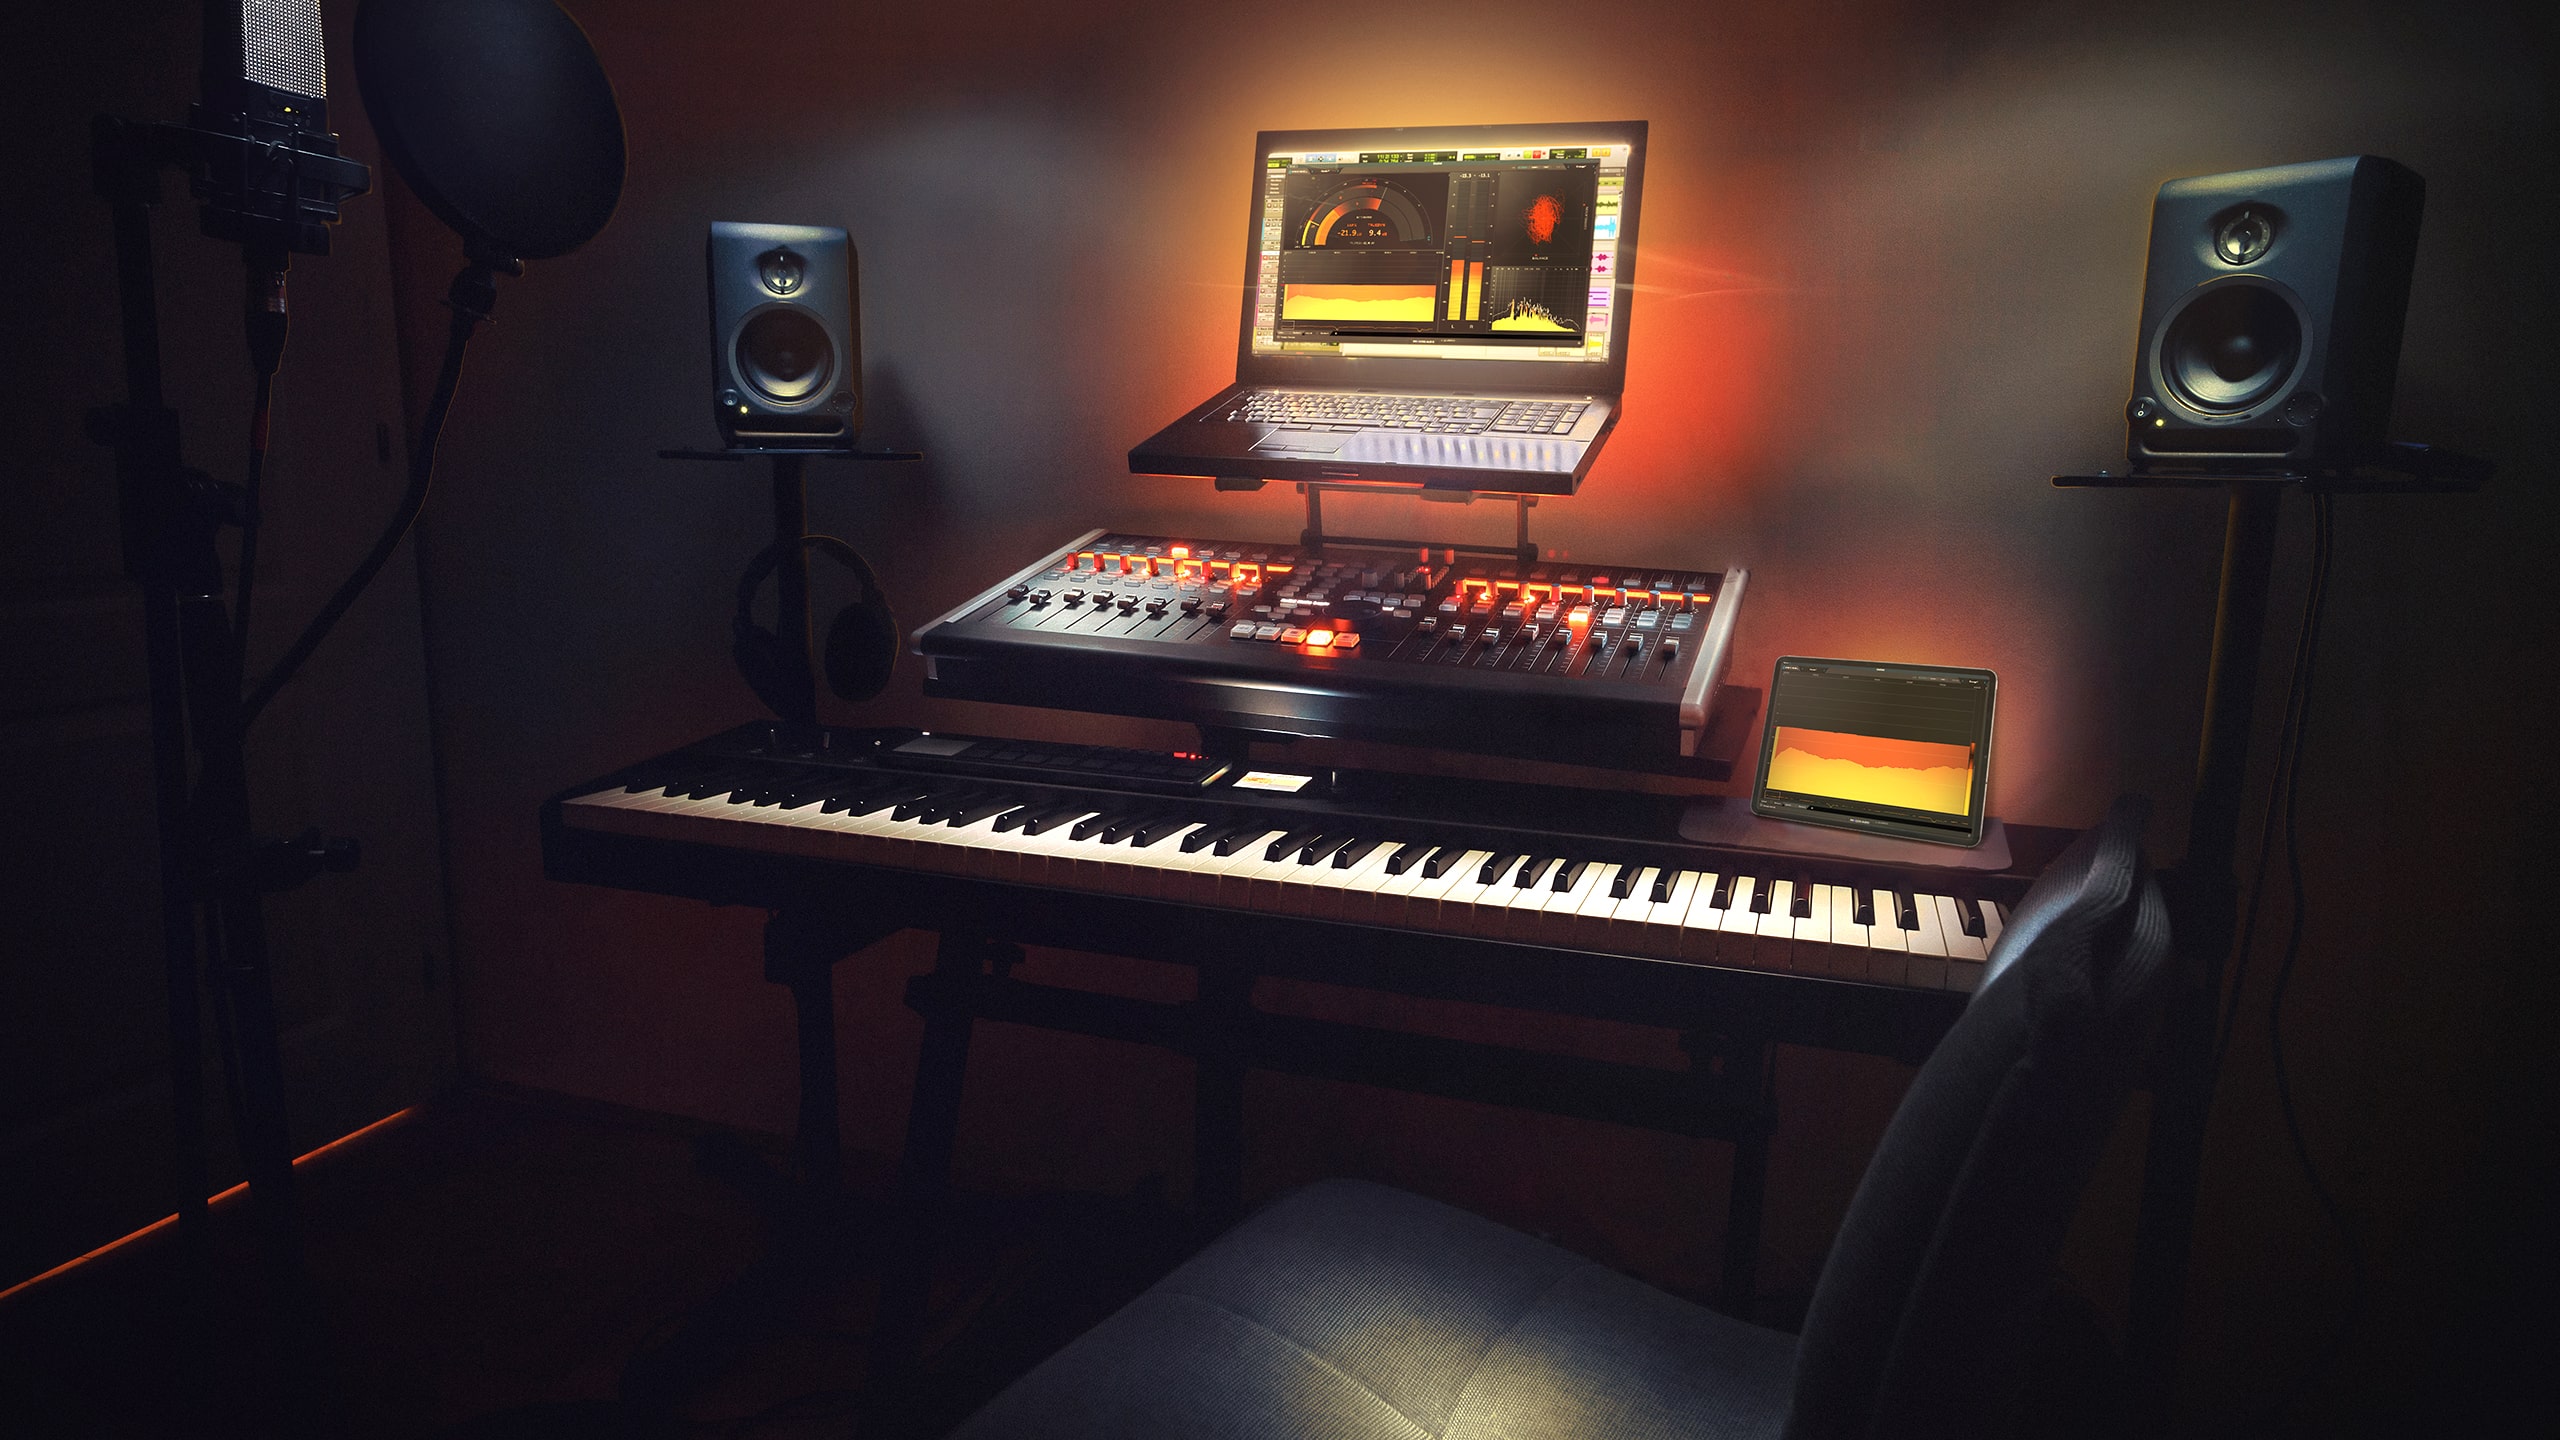
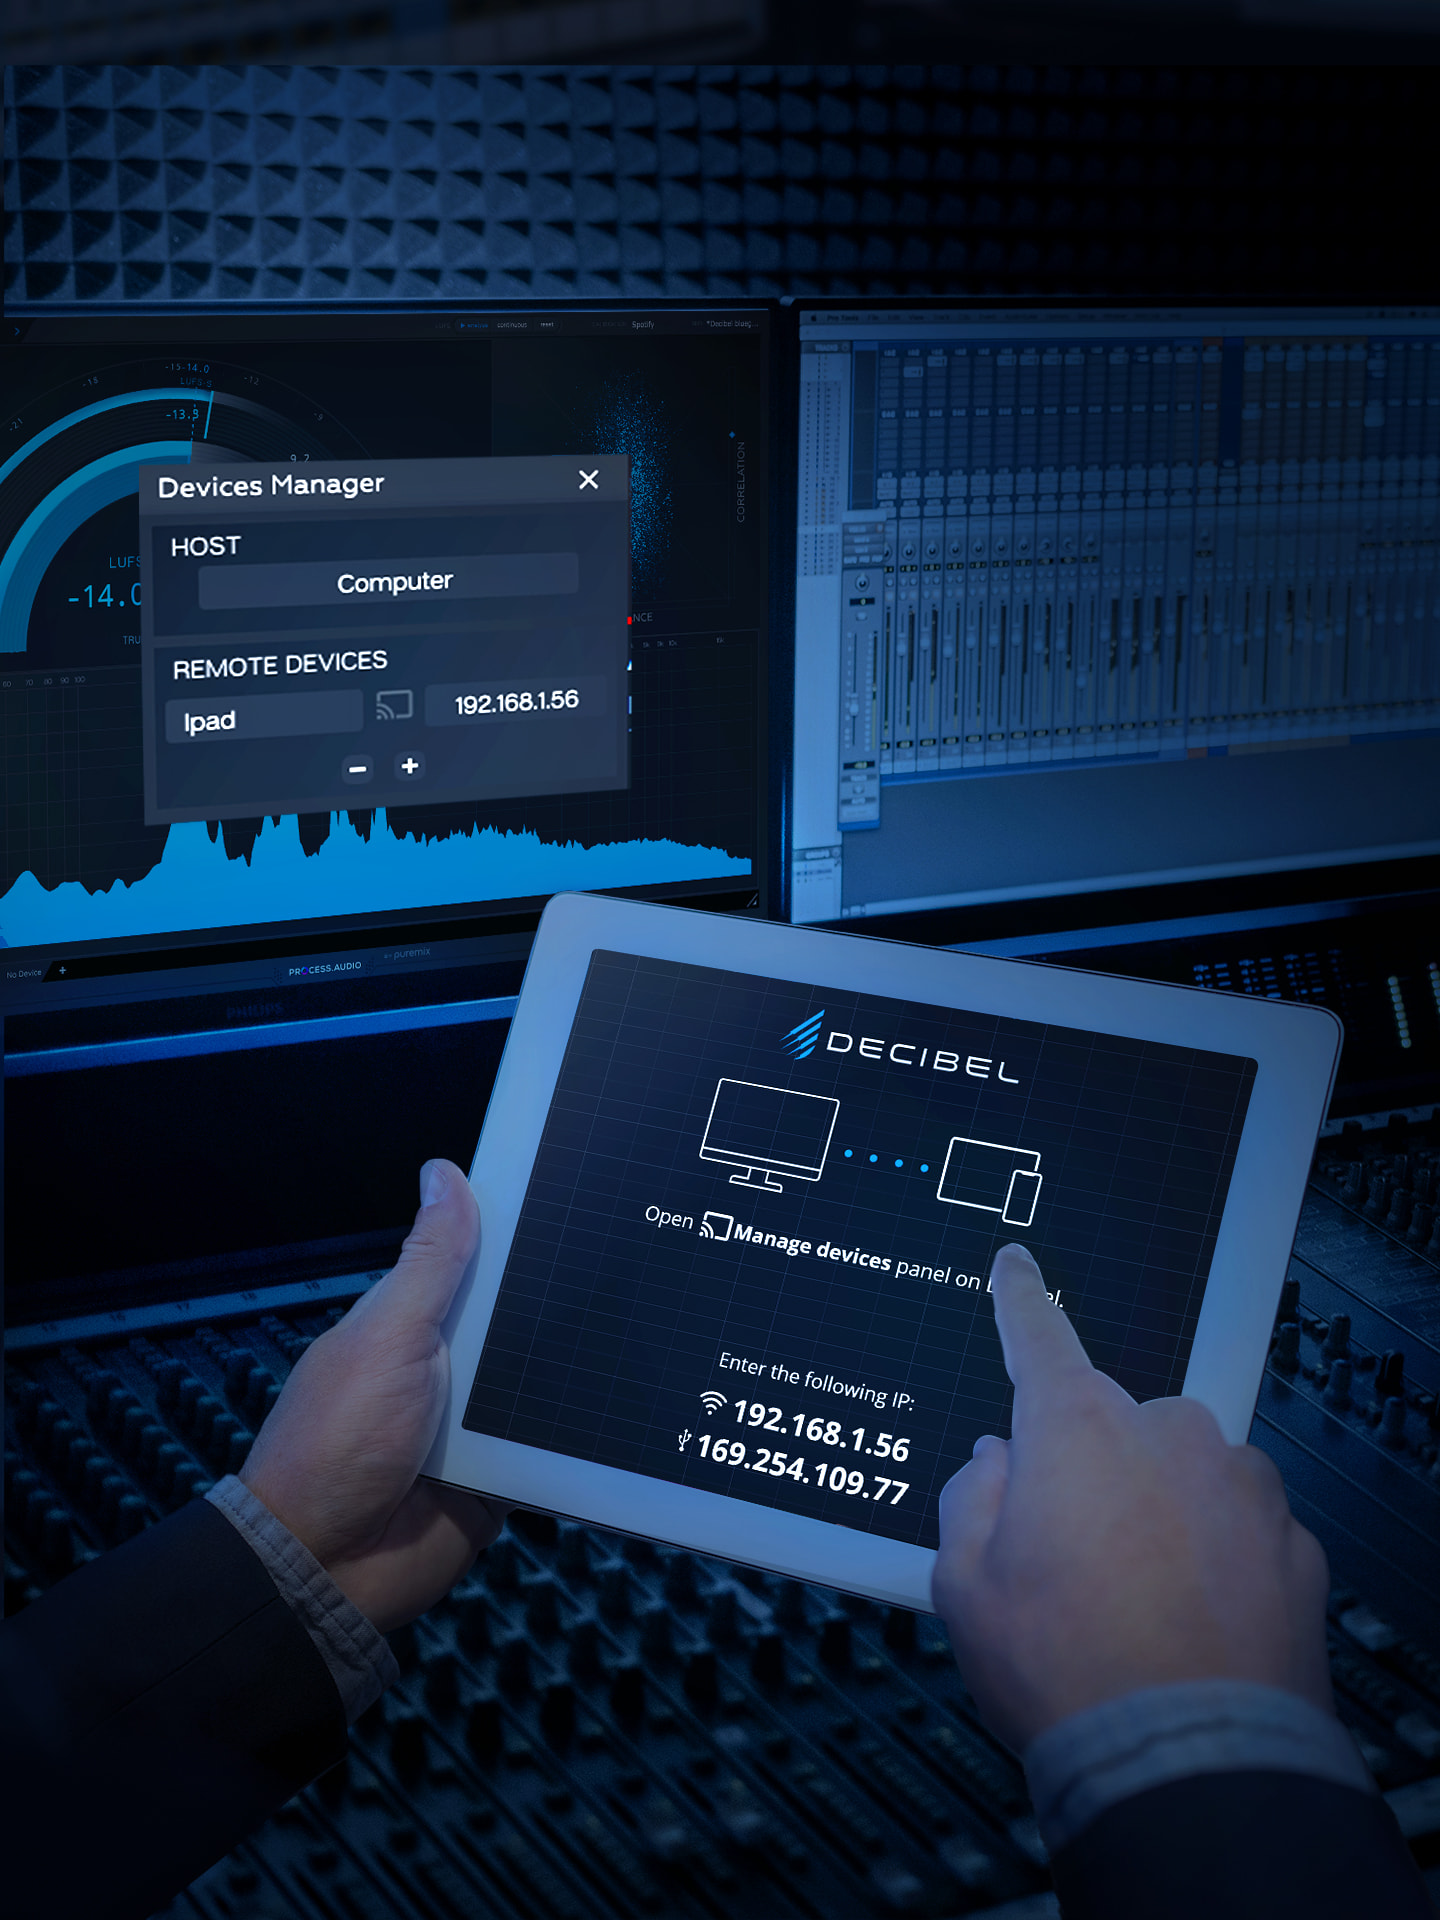
Upgrade your studio by adding fully customizable real-time metering displays (iOS / Android) on your desk.
System Requirements
Minimum requirements
CPU
Intel Core i5 @ 1.7 – 2.2 GHz or better
RAM
8 GB or better
OS
Windows 8.1, Windows 10, Windows 11 (64-bit versions only)
macOS 10.13 (High Sierra) minimum, Apple Silicon compatible (M1+)
macOS 10.13 (High Sierra) minimum, Apple Silicon compatible (M1+)
Protection
iLok authorization
Compatible with all DAWs
Compatible with all DAWs

Pro Tools

Cubase
Logic Pro X

Ableton

Studio One

Luna
Formats
Formats
User Manual
User Manual
Press Kit
Press Kit
Download
Download
Changelog
See full changelog
Version 1.3.4
2025-03-25
- sentry on iOS
- support for Android 14
- works with mobile version 104
Version 1.3.3
2024-07-17
Ilok Host Machine Activation
Version 1.3.2
2023-10-13
- reduces plugin state size when saving a DAW session
- fixes unwanted driver fallback when adding or removing audio device on Mac
- better CPU performance
Version 1.3.1
2023-03-10
- Fix Mac OS Monterey startup problem
Version 1.3.0
2023-03-07
- Fixed VU needle sizing
- Apple Silicon support for AAX
- Changed plugin name to include the brand name
Version 1.2.0
2022-11-28
- Works with 102 Mobile version (iOS & Android)
- New "Spectrogram" module
- Support for Atmos up to 7.1.4 layout in DAWs
- Plugins is no longer flagged as a MIDI effect for AU and AAX (unfortunately sessions with earlier version of Decibel will fail to recall it correctly)
- Replaced "About" window with a better popup
- Bettered popups display with animations and overlay
- Made offline analysis work without needing Rosetta 2 on Silicon devices
- Audio Input/Output Settings are now properly saved and recalled with Standalone version on Windows
- "Keep meters alive" option is now recalled correctly with System Tray app on Mac
- Fixed a bug that prevented to select "None" as output with Standalone on Mac
- Removed "reset" feature of TruePeak on meters where it existed as it was not working as intended and redundant with the LUFS reset button
- Removed multi-mono from AAX version
- Made the clipping led of Numeric Boxes dependant on calibration
- Bettered Histogram display and UX on mobiles
- Stability improvements for Histogram
- Fixed some bugs and improved overall consistency with Presets, Calibrations & Skins (note that preset updated for this version will not work on earlier versions)
- Fixed ergonomy problems with nested dropdown menus inside Calibration & Skin managers
- Fixed a bug that would cause presets with an histogram to get instantly dirty
- Fixed a bug with LUFS analysis recall from plugin state (old saved analysis will be deleted)
- Fixed a bug with CrestFactor that was updating even when there was no playback
- Fixed a bug that would prevent the Max-LUFS-M to be sent to mobiles
- Fixed a resizing bug in Sequoia
- Fixed missing icon for Decibel Driver and updated UID to prevent messing up with BlackHole
- Overall stability and performance improvements
Version 1.1.5
2022-06-30
Fix a crash that can occur at start
Version 1.1.4
2022-05-30
- Fixed a slight error on Spectrum Analyzer
Version 1.1.3
2022-05-27
- M1 compatiblity for Mac
- LUFS duration up to 24h
- LUFS calculation fixes
- Performance & stability improvements
Version 1.1.2
2022-04-13
- Works with mobile version 98 of Decibel Display
- New “GPU Mode” option in main menu for better handling of low-end devices
- Fixed performance issues on Windows
- Fixed hang at UI opening
- Fixed crash upon Adobe Premiere closing
- Fixed crashes related to LUFS analysis
Version 1.1.1
2022-04-06
- Works with mobile version 97
- Fixed hang when shutting down Mac
- Fixed LUFS for Adobe Premiere
- Added missing VST3 Category: Analyzer
- Previous plugin window size is now correctly recalled
- Fixed iOS crash that could occur upon closing
- Factory Presets are now in timecode mode for DAWs
- Fixed wrong Histogram scale values that could occur
Version 1.1.0
2022-03-24
- New module : Stereo Cloud
- New gradient display in skin panel
- The "DIGITAL" category of the skin panel has been split into "RMS" and "FREQUENCY". Your custom presets will be updated accordingly.
- New display for histogram pre-roll
- Histogram pre-roll will now only trigger if the transport position overlaps with a previous analysis
- LUFS analysis is now saved and recovered in/from plugin state (in TimeCode mode)
- LUFS analysis is now supported during bounces (in TimeCode only)
- TrueDyn value is now displayed inside histogram mouse over box
- Added an option to display vertical lines on time marks on histogram
- Smoothed histogram rendering
- Added new "Scale Type" setting to SpectrumAnalyzer
- Added new "Peak hold" feature to SpectrumAnalyzer
- Added new "Key" display to Spectrum Analyzer mouse over (base A frequency can be tweaked from Calibration panel)
- Added changelog display to updater
- Added version parity check between mobile and desktop
- Stability improvements
Version 1.0.3
2022-01-06
- Works with version 93 of mobile app
- Fixed a problem with Histogram's clipping on TimeCode mode
- Fixed a slight error with SpectrumAnalyzer peaks
- Histogram TimeCode's preRoll was appearing in other modes if the mode changed before its end
- Elapsed timeline was not behaving correctly when moving transport in DAW
- Fixed a crash that could occur in TimeCode
- Fixed a crash that could occur when unbypassing the plugin
Version 1.0.2
2021-12-01
- Fix scaling factor errors on Windows
- Now process signal when recording in Protools
- Added an alert when the maximum LUFS recording duration exceeded
Version 1.0.1
2021-11-25
- Fix Pro Tools CPU spikes on play / pause.
- Fix potential True Peak calculation errors with variable buffers.
- Fix Numeric Box responsiveness.
- Fix VU Meter volume compensation in SUM mode.
- Fix Decibel Monitoring core audio driver (OSX only) forcing its previous sample rate on launch. It will now adapt its sample rate to the selected converters.
- Mac OSX Standalone : Rollback to default system output when loosing current audio output
- Fix Histogram timescale showing wrong values.
- Upgrade LUFS analysis capacity to 7.1 signals.
- Works with mobile version 92
Version 1.0.0
2021-11-10
Update Android Icon
Super Meter label True Peak Max
Remove VST2 Path on windows installer
Clearing a Tab sent to Device
No LUFS Processing on Export/Bounce
Fix Wrong init Phasescope and Labels margin
Remove shortcut panels for DAWs
Slow AU Opening Fixed
Crash on Pre-roll for Logic
New Update Window popup
Compatibility with Adobe Premiere
Rename Devices to Displays
Fixed some OpenGL Bugs
Reset LUFS when no sound
Version 0.9.93
2021-11-05
- Decibel Standalone App now always open in foreground
- Fixed a histogram bug that occured when there was lags in DAWs
- Fixed offline analysis measurements errors and signal interferences when exporting
- Fixed the triangle that could occur on histogram when doing an offline analysis
- Fixed the stuttering that occured while resizing in DAWs on Mac
- Fixed a bug that would occur when deleting a tab affected to a mobile device
- Fixed a bug that could cause the device screen bounds to be undersized when maximizing the window
- Fixed a bug that could cause the mobile apps to display labels with the wrong color
- Fixed a crash that occured when clearing clipping with the plugin window closed
- Removed iLok audio input muting behavior (to prevent LUFS processing to be damaged by internet cutoffs)
- Added more protection to the app when iLok license not found
- Made the SuperMeter targets labels disappear with targets instead of scale
- Made the scale hidden by default on SuperMeter and make it disappear automatically when too small
- The peaks shown on SpectrumAnalyzer are now tied to the display mode it currently has
- Prevent some useless and bugprone loopback ips from showing on mobile apps
- Devices paired with no one but present in Device Manager are now automatically paired
- Fixed a bug with automatic device recall on session opening
- Fixed Decibel Manual URL (the manual is still a work in progress)
- Removed useless and/or confusing tooltips
- Clicking on the canvas when the "ADD NEW MODULE" popup is opened now closes it
- Reordered some main menu items
- Increased LUFS and Digital meters font sizes
- Updated presets
- Added new calibrations
Version 0.9.92
2021-10-22
Beta October 2021
- New Android app
- New Frame Rate selector
- New loopback feature: trayIcon & Wasapi
- Histogram smooth & optimized
- Monocontext openGL for all modules
- Devices management multi-instance with force pair feature
- Percentage size for presets & device screen
Version 0.9.9
2020-07-21
- CPU and GPU improvements
- Offline Analysis
- Reporting Panel & Exports
- New LUFS Validator module
Version 0.9.8
2020-07-17
CHANGELOG 0.9.8
- New GUI optimisation
- New module Target Validator
- Offline Analysis: drag & drop
- Improved CPU & Stability (please clean your settings before installing)
Version 0.9.7
2020-07-13
- CPU and GPU improvements
- Offline Analysis
- Reporting Panel & Exports
- New LUFS Validator module
Version 0.9.6
2020-02-24
- New GUI
- Optimized CPU
- Better IOS connection
Version 0.9.4
2019-12-16
- Improved stability
- Improved IOS communication protocol
- Fixed Drawing issues
- Increased performances
Version 0.9.3
2019-11-27
- Add open gl multi context option (default to multi) in order to increase performances
- Fixed preferences bugs
- Fixed UI artefacts
- Resized factory presets to fin 13''
Version 0.9.1
2019-11-18
- GUI quick fix due to histogram opengl bug
Version 0.9.0
2019-11-14
Decibel Beta Test Start
